In Ukraine, machine-learning algorithms and big data scans used to identify war-damaged infrastructure
July 5, 2022

The war in Ukraine is inflicting a heavy toll on both the people and the infrastructure. UNDP is using machine learning to fast-track rebuilding assessments.
The dynamics during a crisis can quickly change, requiring critical information to inform decision-making in a timely fashion. If the information is too little, it is usually of no use. If there is too much it may need extensive resources and timely processing to generate actionable insights.
In Ukraine, identifying the size, type and scope of damaged infrastructure is essential for determining locations and people in need, and to inform the necessary allocation of resources needed for rebuilding. Inquiries about the date, time, location, cause as well as type of damage are generally part of such an assessment. At times obtaining the most accurate – and timely – information can be a challenge.
To help address this issue, the UNDP Country Office in Ukraine is developing a model that uses machine learning and natural language processing techniques to analyse thousands of reports and extract the most relevant information in time to inform strategic decisions.
Classifying key infrastructure
Text mining is a common data science technique; the added value of this model is its customized ability to analyse text from report narratives and then classify them into key infrastructure types. The process relies on ACLED, an open-source database that collates global real-time data. For the pilot testing of its infrastructure assessment model, UNDP used roughly 8,727 reports on military attacks and subsequent events, time-stamped between 24 February and 24 June 2022 (the first four months of the war).
Particularly absent from its database was a taxonomy to categorize the broad range of infrastructure references. Such classification saves time with information processing and can help narrow the scope of assessment if there are specific areas of interest and priorities.
Using its combined experiential knowledge from other crisis zones, it developed a unique model to classify the range of damaged infrastructure into nine categories: industrial, logistics, power/electricity, telecom, agriculture, health, education, shelter and businesses.
If a report, for example, indicated that a residential building in Kyiv was destroyed by military action, the model would classify the reported event in the most appropriate category - in this case, shelter.
The mechanics of the model
A set of relevant keywords was chosen for each of the nine infrastructure types. Th keywords were then compared to the text in the reports. Both the keywords (used to represent a particular type of infrastructure) and the reports were transformed into a numbered vector, whereby each type of infrastructure had one vector, and each report had one vector.
The main goal was to measure the similarity between the two numbers known as cosine similarity: the shorter the distance between a report and an infrastructure type, the higher the semantic relationship between them.
These examples further illustrate the approach:
|
Text: On 26 February 2022, a bridge was blown up near village of Stoyanka, Kyiv.
|
|
Text: On 19 May 2022, a farmer on a tractor hit a mine near Mazhuhivka village, Chernihiv region as a result of which he suffered a leg injury.
|
A minimum threshold of 18 percent was set to determine the validity of the semantic relationship between an infrastructure type and a report. Both examples meet this threshold.
Besides pairing a report with its corresponding infrastructure type, the model by default has also helped with identifying actors involved, time, specific location and reason related to each infrastructure damage. These attributes are already included in ACLED, but the direct association between the report and an infrastructure type ensures the translation of these basic information into more actionable insights.
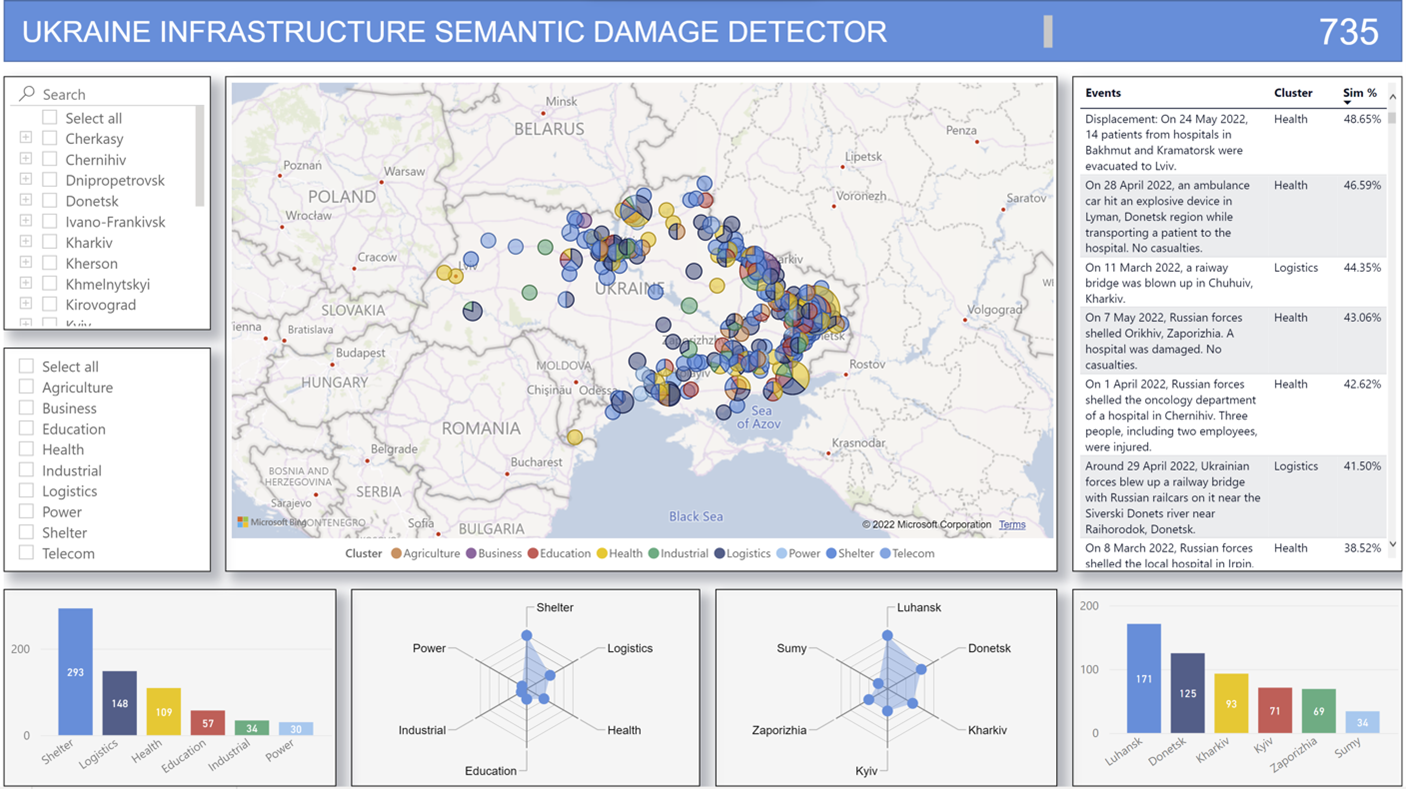
The snapshot below is a data visualization of the model in action, showing the geographical distribution of the infrastructure damage by type that can be further mapped to understand the causes and actors involved. These insights also play a crucial role in designing response strategies, particularly with respect to the safety and security of the assessment team on the ground.

Replicating the model for different contexts
The utility of this Machine Learning model extends beyond classifying infrastructure types. It can be leveraged in broader humanitarian and development contexts. For this reason, the UNDP Country Office in Ukraine is already replicating the model using more real-time and varied data obtained from Twitter to conduct sentiment analysis and better understand the needs and concerns of affected groups.
The traditional way of manually processing information is not only labour-intensive, but it may fall short of delivering the timely insights needed for informed decision-making, especially given the volume of digital information available nowadays. As the war in Ukraine highlights, being able to uncover timely insights means saving lives.
As an alternative, this model offers speed and efficiency, which can help reduce operational costs in several situations. UNDP’s Decision Support Unit, which coordinates assessments internally and in collaboration with a range of partners, is supporting the development of this model. The Infrastructure Semantic Damage Detector is publicly accessible on tinyurl.com/semdam.
This story was produced in cooperation with the UNDP Chief Digital Office. For more information, contact Aladdin at aladdin.shamoug@undp.org.

 Locations


